Multiple Choice
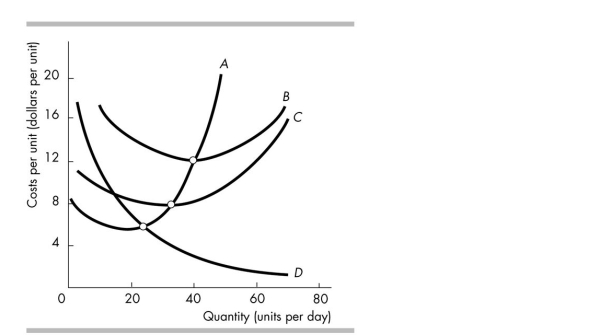
-In the above figure, as output increases, the distance between curves B and C decreases because
A) there are increasing marginal costs as output increases.
B) average fixed cost decreases as output increases.
C) total cost decreases as output increases.
D) there are diminishing returns to average total cost.
Correct Answer:

Verified
Correct Answer:
Verified
Q25: <img src="https://d2lvgg3v3hfg70.cloudfront.net/TB4952/.jpg" alt=" -In the above
Q26: <img src="https://d2lvgg3v3hfg70.cloudfront.net/TB4952/.jpg" alt=" -The table above
Q27: Which of the following would be classified
Q28: <img src="https://d2lvgg3v3hfg70.cloudfront.net/TB4952/.jpg" alt=" -Cindy's Shirts' production
Q29: Tudor's Deli and Catering could have sold
Q31: <img src="https://d2lvgg3v3hfg70.cloudfront.net/TB4952/.jpg" alt=" -The above figure
Q32: When a firm experiences economies of scale,
Q33: When long- run average cost decreases as
Q34: Increasing marginal returns to labour might occur
Q35: <img src="https://d2lvgg3v3hfg70.cloudfront.net/TB4952/.jpg" alt=" -The above table