Multiple Choice
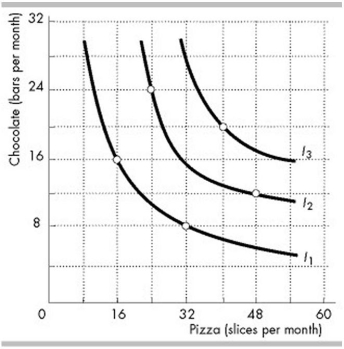
-The indifference curves in the figure above (I1, I2 and I3) reflect Peter's consumption preferences. Peter prefers consuming _______ to consuming _______.
A) 32 slices of pizza and 8 chocolate bars; 16 slices of pizza and 16 chocolate bars
B) 24 slices of pizza and 24 chocolate bars; 40 slices of pizza and 20 chocolate bars
C) 48 slices of pizza and 12 chocolate bars; 24 slices of pizza and 24 chocolate bars
D) 40 slices of pizza and 20 chocolate bars; 48 slices of pizza and 12 chocolate bars
Correct Answer:

Verified
Correct Answer:
Verified
Q23: <img src="https://d2lvgg3v3hfg70.cloudfront.net/TB4952/.jpg" alt=" -The indifference curves
Q101: <img src="https://d2lvgg3v3hfg70.cloudfront.net/TB4952/.jpg" alt=" -The above figure
Q103: Which of the following statements is FALSE?<br>A)
Q104: <img src="https://d2lvgg3v3hfg70.cloudfront.net/TB4952/.jpg" alt=" -Consider the change
Q105: <img src="https://d2lvgg3v3hfg70.cloudfront.net/TB4952/.jpg" alt=" -The indifference curves
Q107: <img src="https://d2lvgg3v3hfg70.cloudfront.net/TB4952/.jpg" alt=" -Lizzie's preferences are
Q108: Which of the following statements is true?<br>A)
Q110: Samara's income is $30 a month and
Q111: If an individual's income increases,<br>A) the person's
Q402: <img src="https://d2lvgg3v3hfg70.cloudfront.net/TB5274/.jpg" alt=" -In the above