Multiple Choice
Given the scatter diagram below, that shows the number of workdays absent per year based on the age of the employees, which of the following statements are true? 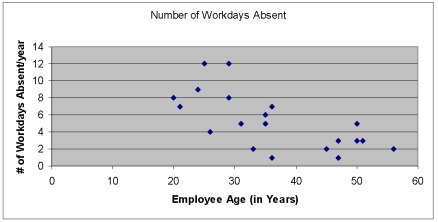
A) There is clearly no relationship whatsoever between an employee's age and the number of workday absences that they take.
B) There is a single but strong outlier in this data set.
C) There appears to be an inverse relationship between the two variables
D) A & B are true
E) B & C are true
Correct Answer:

Verified
Correct Answer:
Verified
Q52: i. If there is absolutely no relationship
Q92: <img src="https://d2lvgg3v3hfg70.cloudfront.net/TB7521/.jpg" alt=" -What is the
Q93: Information was collected from employee records to
Q94: What is the coefficient of determination? <img
Q95: i. A coefficient of correlation r close
Q97: Using a 95% significance level, what is
Q98: i. The strength of the correlation between
Q99: <img src="https://d2lvgg3v3hfg70.cloudfront.net/TB7521/.jpg" alt=" -What is the
Q100: In correlation analysis, the independent variable is<br>A)
Q101: i. The purpose of correlation analysis is