Multiple Choice
The partial megastat output below is regression analysis of the relationship between annual payroll and number of wins in a season for 28 teams in professional sports. The purpose of the analysis is to predict the number of wins when given an annual payroll in $millions. Although technically not a sample, the baseball data below will be treated as a convenience sample of all major league professional sports 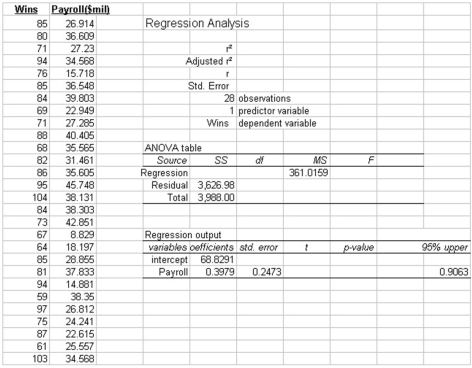
Refer to the printout above. The regression equation is:
A) = 2,049 + 68.8291x
B) = 82.5157 + 28.2049x
C) = 28.2049 + 7.5888x
D) = 82.5157 + 7.5888x
E) = 7.5888 + 28.2049x
Correct Answer:

Verified
Correct Answer:
Verified
Q23: i. If the coefficient of correlation is
Q26: We have collected price per share and
Q27: i. In order to visualize the form
Q28: Consider the following scatter plot and regression
Q29: i. A scatter diagram is a chart
Q31: Information was collected from employee records to
Q32: What will be the number of housing
Q33: Given the following five points: (-2,0), (-1,0),
Q34: The partial megastat output below is regression
Q35: In correlation analysis, the dependent variable is<br>A)