Multiple Choice
Use the scatter diagrams to verify which statements are correct:
Chart A 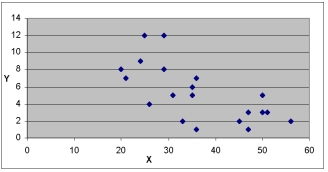
Chart B 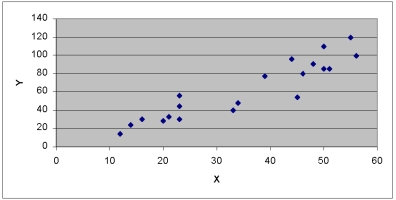
Chart C 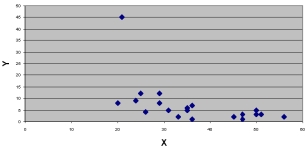
A) The variables in Chart A have a strong positive correlation
B) The variables in Chart C have a strong positive correlation
C) The variables in Chart B have a negative correlation
D) Charts A & B have no obvious outliers
E) None of the choices are correct
Correct Answer:

Verified
Correct Answer:
Verified
Q4: Data is collected from 20 sales people
Q5: Information was collected from employee records to
Q6: <img src="https://d2lvgg3v3hfg70.cloudfront.net/TB7521/.jpg" alt="
Q7: Which value of r indicates a stronger
Q8: What does a coefficient of correlation of
Q10: i. A coefficient of correlation r close
Q11: A sales manager for an advertising agency
Q12: i. A coefficient of correlation r close
Q13: i. The basic question in testing the
Q14: i. The strength of the correlation between