Multiple Choice
Use the scatter diagrams to verify which statements are correct:
Chart A 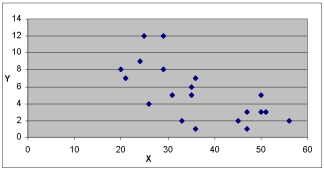
Chart B 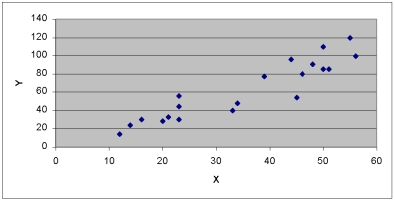
Chart C 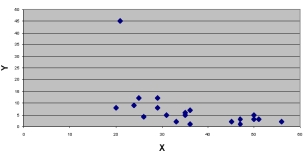
A) The variables in Chart A have a positive correlation
B) The variables in Chart B have a positive correlation
C) The variables in Chart B have a negative correlation
D) The variables in Chart A have a stronger correlation than the variables in Chart B
E) B & D are correct
Correct Answer:

Verified
Correct Answer:
Verified
Q122: i. A t test is used
Q123: If all the plots on a scatter
Q124: A sales manager for an advertising agency
Q125: <img src="https://d2lvgg3v3hfg70.cloudfront.net/TB7521/.jpg" alt=" The regression analysis
Q126: We have collected price per share and
Q128: Given the following five points: (-2,0), (-1,0),
Q129: Data is collected from 20 sales people
Q130: A sales manager for an advertising agency
Q131: The difference between formulas for constructing a
Q132: The correlation between two variables is -0.63