Multiple Choice
The partial megastat output below is regression analysis of the relationship between annual payroll and number of wins in a season for 28 teams in professional sports. The purpose of the analysis
Is to predict the number of wins when given an annual payroll in $millions. Although technically not a sample, the baseball data below will be treated as a convenience sample of all major league professional sports. 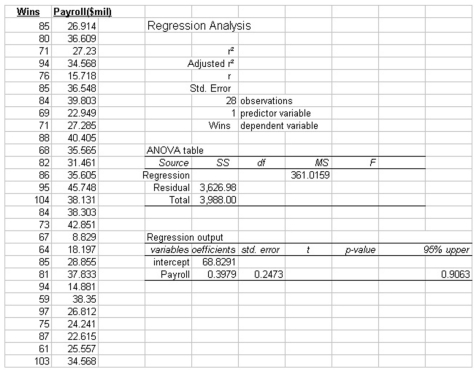 Refer to the printout above. The critical value of F, at the 5%level of significance, to be used in the global test of the model is: (Choose closest)
A) 7.77
B) 249
C) 4.17
D) 7.56
E) 4.24
Correct Answer:

Verified
Correct Answer:
Verified
Q19: A sales manager for an advertising agency
Q20: Data is collected from 20 sales people
Q21: The partial megastat output below is regression
Q22: Data is collected from 20 sales people
Q23: <img src="https://d2lvgg3v3hfg70.cloudfront.net/TB7521/.jpg" alt=" -What is the
Q23: i. If the coefficient of correlation is
Q26: We have collected price per share and
Q27: i. In order to visualize the form
Q28: Consider the following scatter plot and regression
Q29: i. A scatter diagram is a chart