Multiple Choice
The partial megastat output below is regression analysis of the relationship between annual payroll and number of wins in a season for 28 teams in professional sports. The purpose of the analysis
Is to predict the number of wins when given an annual payroll in $millions. Although technically not a sample, the baseball data below will be treated as a convenience sample of all major league professional sports. 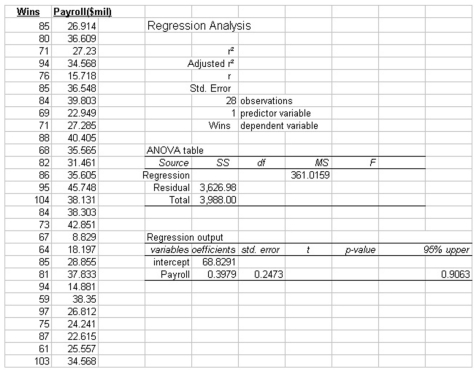 Refer to the printout above. The critical value of t, for testing the slope of the regression line is:
A) 2.042
B) 1.706
C) 1.314
D) 1.703
E) 1.061
Correct Answer:

Verified
Correct Answer:
Verified
Q133: i. In order to visualize the form
Q134: Suppose the least squares regression equation is
Q135: Information was collected from employee records to
Q136: Which value of r indicates a stronger
Q137: The correlation between two variables is -0.63
Q139: A sales manager for an advertising agency
Q140: Information was collected from employee records to
Q141: i. If we are studying the relationship
Q142: i. The coefficient of determination can only
Q143: i. The smaller the sample, the smaller