Multiple Choice
The partial megastat output below is regression analysis of the relationship between annual payroll and number of wins in a season for 28 teams in professional sports. The purpose of the analysis
Is to predict the number of wins when given an annual payroll in $millions. Although technically not a sample, the baseball data below will be treated as a convenience sample of all major league professional sports. 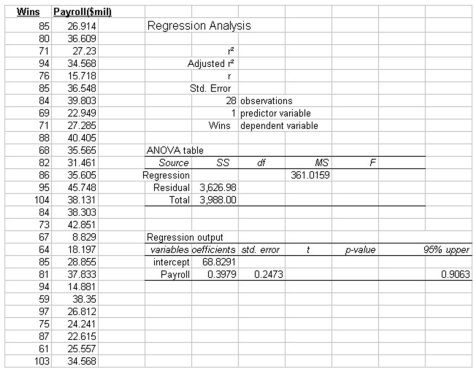 Refer to the printout above. The critical value of t, at the 5% level of significance, for testing the slope of the regression line is:
A) 2.262
B) 1.833
C) 2.228
D) 3.717
E) 2.201
Correct Answer:

Verified
Correct Answer:
Verified
Q61: Data is collected from 20 sales people
Q62: What is the measure that indicates how
Q63: A sales manager for an advertising agency
Q64: In the regression equation, Y' = a
Q65: i. The technique used to measure the
Q67: The partial megastat output below is regression
Q68: Which value of r indicates a stronger
Q69: <img src="https://d2lvgg3v3hfg70.cloudfront.net/TB7521/.jpg" alt=" -What is the
Q70: <img src="https://d2lvgg3v3hfg70.cloudfront.net/TB7521/.jpg" alt=" -What is the
Q71: At what interest rate will there be