Multiple Choice
The mean gross annual incomes of certified tack welders are normally distributed with the mean of $50,000 and a standard deviation of $4,000. The ship building association wishes to find out whether their tack welders earn more or less than $50,000 annually. The alternate hypothesis is that the mean is not $50,000.
Given the following megastat printout, what conclusions can be made? 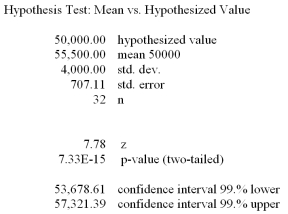
A) There is a 1.68% chance of getting these sample results if the annual income is actually $50,000.
B) Since the p-value is 7%, we reject the null hypothesis at a 5% level of significance.
C) Since the p-value is 9%, we have insufficient evidence to reject the null hypothesis at the 5% level of significance.
D) Since the p-value is 9%, we reject the null hypothesis at the 1% level of significance.
E) None of these statements are correct.
Correct Answer:

Verified
Correct Answer:
Verified
Q15: A random sample of size 15 is
Q17: The following summarizes the average of the
Q21: It is claimed that in a bushel
Q22: It is claimed that in a bushel
Q24: What are the two rejection areas in
Q24: What are the two rejection areas in
Q164: A manufacturer claims that less than 1%
Q206: If α = 0.05 for a two-tailed
Q213: Based on the Nielsen ratings, the local
Q214: The dean of a business school claims