Multiple Choice
Based on the graph below, how can we best describe the shape of this distribution? 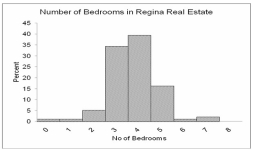
A) Relatively symmetrical
B) Positively skewed
C) Negatively skewed
D) No variation
E) Bimodal
Correct Answer:

Verified
Correct Answer:
Verified
Related Questions
Q61: According to the Empirical Rule,_ percent of
Q62: David Electronics had a profit of $10
Q63: Using the information gathered for real estate
Q64: A sample of light trucks using diesel
Q65: A company's human resource department was interested
Q67: A study of the scores on an
Q68: What is the value of the Pearson
Q69: The weights of a sample of 100
Q70: The coefficient of variation for a set
Q71: If a distribution is highly skewed, the