Multiple Choice
Based on the graph below, how can we best describe the shape of this distribution? 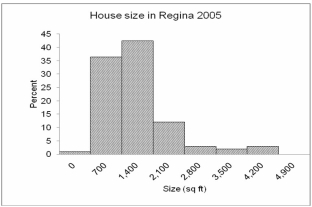
A) Symmetrical
B) Positively skewed
C) Negatively skewed
D) No variation
E) Bimodal
Correct Answer:

Verified
Correct Answer:
Verified
Related Questions
Q13: If two sets of data are in
Q14: The number of work stoppages in a
Q15: A small manufacturing company with 52 employees
Q17: If a set of observations contains an
Q19: Samples of the wires coming off the
Q20: The ages of a sample of the
Q21: Which measure of dispersion disregards the algebraic
Q22: The weights of a sample of 100
Q23: The printout below is a summary of
Q44: The value that occurs most often in