menu-iconExamlexExamLexServices

Discover

Ask a Question
  1. All Topics
  2. Topic
    Statistics
  3. Study Set
    Basic Statistics Study Set 1
  4. Exam
    Exam 3: Describing Data: Numerical Measures
  5. Question
    Based on the Graph Below, How Can We Best Describe
Solved

Based on the Graph Below, How Can We Best Describe

Question 156

Question 156

Multiple Choice

Based on the graph below, how can we best describe the shape of this distribution? Based on the graph below, how can we best describe the shape of this distribution?   A)  Relatively symmetrical B)  Positively skewed C)  Negatively skewed D)  No variation E)  Bimodal
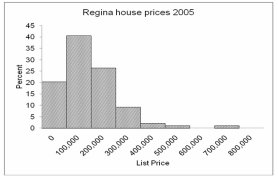

A) Relatively symmetrical
B) Positively skewed
C) Negatively skewed
D) No variation
E) Bimodal

Correct Answer:

verifed

Verified

Unlock this answer now
Get Access to more Verified Answers free of charge

Related Questions

Q151: The weights of a sample of 100

Q152: The Federal Aviation Administration reported that passenger

Q153: A bottling company offers three kinds of

Q154: Based on the values of the arithmetic

Q155: i. A value that is typical or

Q157: i. If there is an even number

Q158: 75 litres. What is the Pearson's coefficient

Q159: The weights (in kilograms) of a group

Q160: What disadvantage(s) are there of the mean

Q161: A study of business faculty in Ontario

Examlex

ExamLex

About UsContact UsPerks CenterHomeschoolingTest Prep

Work With Us

Campus RepresentativeInfluencers

Links

FaqPricingChrome Extension

Download The App

Get App StoreGet Google Play

Policies

Privacy PolicyTerms of ServiceHonor CodeCommunity Guidelines

Scan To Download

qr-code

Copyright © (2025) ExamLex LLC.

Privacy PolicyTerms Of ServiceHonor CodeCommunity Guidelines