Multiple Choice
Listed below is the box plot of average earnings ratio for full-year, full-time female workers from 1999 to 2008. 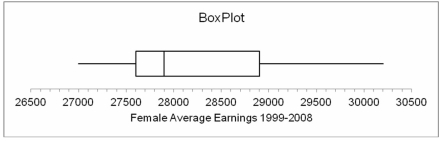 From this we can interpret that the distribution of average earnings for women for the years 1999-
2008 was:
A) Symmetrical
B) Positively skewed
C) Negatively skewed
D) Bimodal
E) Variable
Correct Answer:

Verified
Correct Answer:
Verified
Related Questions
Q34: What is a disadvantage of the range
Q104: A disadvantage of using an arithmetic mean
Q105: The closing prices of a common stock
Q106: Listed below is the box plot of
Q108: If there are an odd number of
Q110: i. An outlier is a data point
Q111: A sample of the homes currently offered
Q112: Which measure of central tendency is found
Q113: The _(measure of central tendency) cannot be
Q114: The weights of a sample of 100