Multiple Choice
Statistics Canada report 2010 results in the following chart. 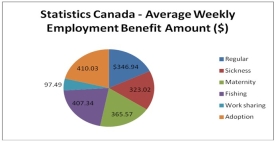 Is the data quantitative or qualitative? What is the name of the table shown?
A) quantitative, simple table
B) quantitative, pie chart
C) qualitative, frequency table
D) qualitative, pie chart
E) quantitative, bar chart
Correct Answer:

Verified
Correct Answer:
Verified
Q4: Which of the following would be most
Q44: A group of 100 students were surveyed
Q45: The chart below shows the Gross Domestic
Q47: The Lake Ontario Credit Union selected a
Q48: For a stem-and-leaf display, the stem for
Q50: The suggested class interval based on number
Q51: For the following distribution of heights, what
Q52: Refer to the following cumulative frequency distribution
Q53: The best means to display data that
Q54: What is the following table called? <img