Multiple Choice
The chart below can be best described as 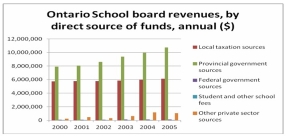
A) Line chart
B) Bar chart
C) Clustered bar chart
D) Stacked bar chart
E) Cumulative stacked bar chart
Correct Answer:

Verified
Correct Answer:
Verified
Related Questions
Q80: (i) In constructing a frequency distribution, you
Q81: Refer to the following chart showing a
Q82: Refer to the following distribution of commissions:
Q83: Refer to the following ages (rounded to
Q84: In a cumulative frequency distribution,_ percent of
Q86: The following class intervals for a frequency
Q87: (i) Bar charts are useful for showing
Q88: The grades on a statistics exam for
Q89: Refer to the following distribution of ages:
Q90: In constructing a frequency polygon, the class