Multiple Choice
Refer to the following chart showing a distribution of exporting firms: 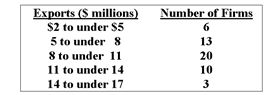
-For the distribution above, what is the midpoint of the class with the greatest frequency?
A) $6 million
B) $9.5 million
C) $15.5 million
D) The midpoint cannot be determined
E) None of the choices are correct
Correct Answer:

Verified
Correct Answer:
Verified
Q53: The best means to display data that
Q54: What is the following table called? <img
Q55: A sample distribution of hourly earnings in
Q56: <img src="https://d2lvgg3v3hfg70.cloudfront.net/TB7521/.jpg" alt=" -Students under the
Q57: Consider the following stem and leaf plot:
Q59: The age distribution of a sample of
Q60: (i) A frequency distribution is grouping of
Q61: Refer to the following ages (rounded to
Q62: Refer to the following ages (rounded to
Q63: Refer to the following chart showing a