Multiple Choice
Analyze the graph below. Do you find any inconsistencies or errors? 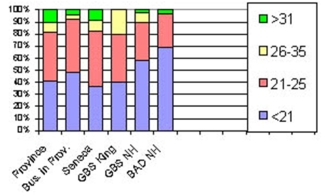
A) You shouldn't have 6 bars all on a single graph
B) Students under 21 don't go to college
C) This graph suggests there are the same number of students in the entire province as in each of the other groups shown
D) The classes are not all mutually exclusive
E) You can't have open ended classes in a bar chart
Correct Answer:

Verified
Correct Answer:
Verified
Q30: (i) A frequency table is a grouping
Q31: (i) Pie charts are useful for showing
Q32: The chart below can be best described
Q33: <img src="https://d2lvgg3v3hfg70.cloudfront.net/TB7521/.jpg" alt=" -Province wide, approximately
Q34: Refer to the following distribution of commissions:
Q36: If you are constructing a stem-and-leaf display,
Q37: Refer to the following cumulative frequency distribution
Q38: (i). The stem in a stem-and-leaf
Q39: Refer to the following price of jeans
Q40: The chart below shows the Gross Domestic