Multiple Choice
Given the following stem and leaf plot, determine the largest value in the data set. 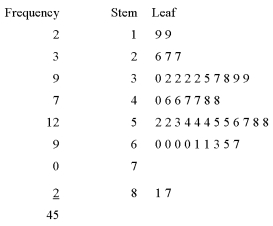
A) 87
B) 819
C) 28
D) 17
E) 817
Correct Answer:

Verified
Correct Answer:
Verified
Related Questions
Q38: When a class interval is expressed as:
Q91: Refer to the following ages (rounded to
Q92: The Lake Ontario Credit Union selected a
Q93: What type of graph is this? <img
Q95: What is the relative frequency for those
Q96: What are the true class limits for
Q98: Why are unequal class intervals sometimes used
Q99: In a simple line chart, where is
Q100: Refer to the following distribution of commissions:
Q101: The chart below can be best described