Multiple Choice
The figure shows the graphs of the cost and revenue functions for a company that manufactures and sells binoculars. Use the information in the figure to answer the question.
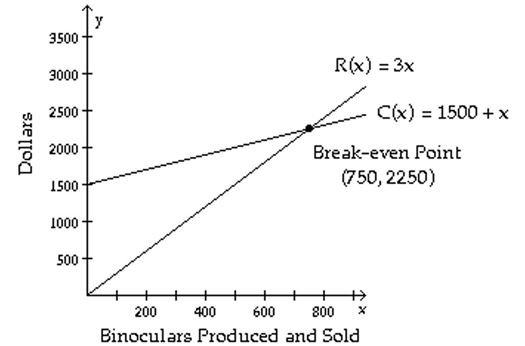
-More than how many binoculars must be produced and sold for the company to have a profit gain?
A) 750 binoculars
B) 2250 binoculars
C) 2700 binoculars
D) 1500 binoculars
Correct Answer:

Verified
Correct Answer:
Verified
Q63: Solve the problem.<br>-The Family Fine Arts Center
Q64: Solve the problem<br>-A deli sells three sizes
Q65: Solve the problem.<br>-In 1985, in the town
Q66: Solve the system of equations by
Q67: Determine if the given ordered triple
Q69: Solve the system by the method
Q70: Solve the system of equations by
Q71: Solve the system of equations by
Q72: Write the partial fraction decomposition of
Q73: Solve the system of equations.<br>- <span