Multiple Choice
The figure shows the graphs of the cost and revenue functions for a company that manufactures and sells binoculars. Use the information in the figure to answer the question.
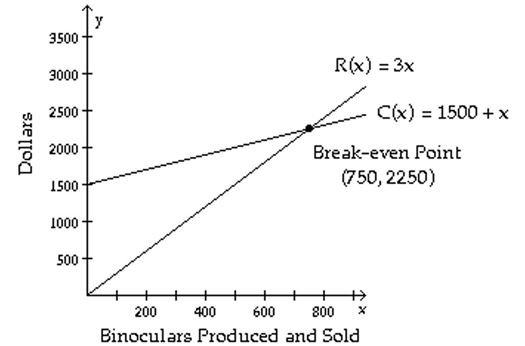
-Fewer than how many binoculars must be produced and sold for the company to have a profit loss?
A) 2700 binoculars
B) 750 binoculars
C) 2250 binoculars
D) 1500 binoculars
Correct Answer:

Verified
Correct Answer:
Verified
Q84: Solve the problem.<br>-A bank teller has 46
Q85: Solve the problem.<br>-Steve invests in a
Q86: Solve the system by the method
Q87: Solve the system by the method
Q88: Solve the system by the addition
Q90: The figure shows the graphs of
Q91: Solve the system by the method
Q92: Solve the problem.<br>-In the town of Milton
Q93: Solve the system by the substitution
Q94: Solve the system of equations by