Multiple Choice
Solve.
-Suppose that a polynomial function is used to model the data shown in the graph below. 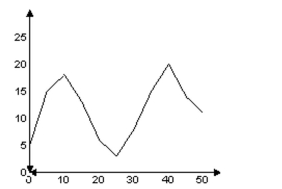
For what intervals is the function increasing?
A) 10 through 25 and 40 through 50
B) 0 through 40
C) 0 through 10 and 20 through 50
D) 0 through 10 and 25 through 40
Correct Answer:

Verified
Correct Answer:
Verified
Related Questions
Q76: Find the range of the quadratic
Q77: Use the Intermediate Value Theorem to
Q78: Graph the polynomial function.<br>- <span class="ql-formula"
Q79: Find the range of the quadratic
Q80: Find the range of the quadratic
Q82: Find the coordinates of the vertex
Q83: Solve the problem<br>-Among all pairs of numbers
Q84: Find the zeros for the polynomial
Q85: The graph of a quadratic function
Q86: Find the zeros of the polynomial