Multiple Choice
Solve.
-Suppose that a polynomial function is used to model the data shown in the graph below. 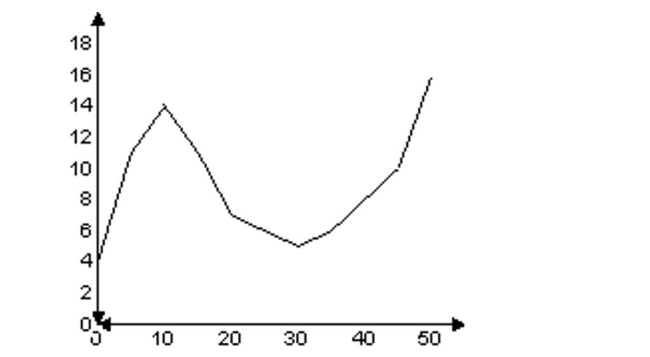 For what intervals is the function decreasing?
A) 10 through 30
B) 0 through 10 and 30 through 50
C) 0 through 30
D) 10 through 20 and 30 through 50
Correct Answer:

Verified
Correct Answer:
Verified
Related Questions
Q110: The graph of a quadratic function
Q111: Use the Leading Coefficient Test to
Q112: Find the x-intercepts of the polynomial
Q113: Use the Leading Coefficient Test to
Q114: Determine whether the graph of the
Q116: Find the x-intercepts (if any) for
Q117: Find the axis of symmetry of
Q118: Determine whether the function is a
Q119: Find the zeros for the polynomial
Q120: Solve the problem.<br>-Write an equation in standard