Multiple Choice
Solve.
-Suppose that a polynomial function is used to model the data shown in the graph below. 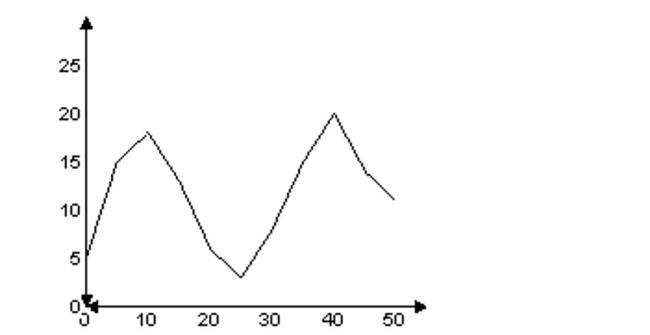 Determine the degree of the polynomial function of best fit and the sign of the leading coefficient.
A) Degree 5; negative leading coefficient.
B) Degree 5; positive leading coefficient.
C) Degree 4; positive leading coefficient.
D) Degree 4; negative leading coefficient.
Correct Answer:

Verified
Correct Answer:
Verified
Q104: Find the x-intercepts (if any) for
Q105: Find the zeros of the polynomial
Q106: Determine whether the graph of the polynomial
Q107: Find the coordinates of the vertex
Q108: Use the Intermediate Value Theorem to
Q110: The graph of a quadratic function
Q111: Use the Leading Coefficient Test to
Q112: Find the x-intercepts of the polynomial
Q113: Use the Leading Coefficient Test to
Q114: Determine whether the graph of the