Multiple Choice
Graph the line y = mx + b for the given values.
- 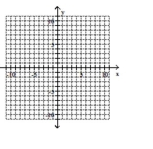
A) 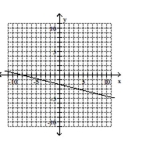
B) 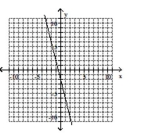
C) 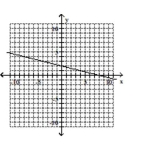
D) 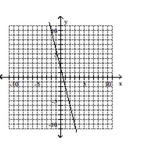
Correct Answer:

Verified
Correct Answer:
Verified
Related Questions
Q1: Plot the point<br>-(-2.5, 1.5) <img src="https://d2lvgg3v3hfg70.cloudfront.net/TB6914/.jpg" alt="Plot
Q3: The map below has horizontal and
Q4: Graph the line.<br>- <span class="ql-formula" data-value="y
Q5: Write the equation of the line
Q6: Plot the point<br>-(-4, 1) <img src="https://d2lvgg3v3hfg70.cloudfront.net/TB6914/.jpg" alt="Plot
Q7: The map below has horizontal and
Q8: The map below has horizontal and
Q9: The map below has horizontal and
Q10: Find the missing coordinate to complete
Q11: Plot the point<br>-(-1, -3) <img src="https://d2lvgg3v3hfg70.cloudfront.net/TB6914/.jpg" alt="Plot