Multiple Choice
The following scatterpolt shows the percentage of the vote a candidate received in the 2004 senatoral elections according to the voter's income level based on an exit poll of the voters conducted bu CNN. The income levels 1-8 correspond to the followng income classes: 1=under $15,00; 2=$15-30,000; 3=$30-50,000; 4=$50=75,000; 5=$75-100,000; 6=$100-150,000; 7=$150=200,000; 8=$200,000 or more.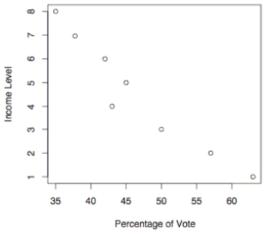
Use the election scatterplot to determine whether there is a correlation between percentage of vote and income level at the 0.01 significance level with a null hypothesis of Pz=0 .
A) The test statistic is between the critical values, so we fail to reject the null hypothesis. There is no evidence to support a claim of correlation between percentage of vote and income level.
B) The test statistic is not between the critical values, so we fail to reject the null hypothesis. There is no evidence to support a claim of correlation between percentage of vote and income level.
C) The test statistic is between the critical values, so we reject the null hypothesis. There is sufficient evidence to support a claim of correlation between percentage of vote and income level.
D) The test statistic is not between the critical values, so we reject the null hypothesis. There is sufficient evidence to support a claim of correlation between percentage of vote and income level.
Correct Answer:

Verified
Correct Answer:
Verified
Q11: A rank correlation coefficient is to be
Q12: The following scatterpolt shows the percentage of
Q13: Use the sign test to test
Q14: Find the ranks corresponding to the ages
Q15: Use the Wilcoxon rank-sum approach to
Q17: When applying the runs test for randomness
Q18: If test A has an efficiency rating
Q19: Which statement is false about the Wilcoxon
Q20: Describe the sign test. What types of
Q21: Use the runs test to determine whether