Essay
The following table gives the US domestic oil production rates (excluding Alaska) from 1987 to 2002. A regression equation was fit to the data and the residual plot is shown below.
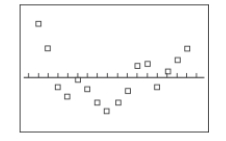
Does the residual plot suggest that the regression equation is a bad model? why or why not?
Correct Answer:

Verified
Yes, the residual plot suggests that the...View Answer
Unlock this answer now
Get Access to more Verified Answers free of charge
Correct Answer:
Verified
View Answer
Unlock this answer now
Get Access to more Verified Answers free of charge
Q21: The results for several randomly selected
Q22: Given the linear correlation coefficient r and
Q23: Use the given data to find
Q24: Find the explained variation for the
Q25: When testing to determine if correlation
Q27: For each of 200 randomly selected cities,
Q28: Suppose you will perform a test
Q29: Give an example of a pair of
Q30: A set of data consists of
Q31: Use the given data to find