Essay
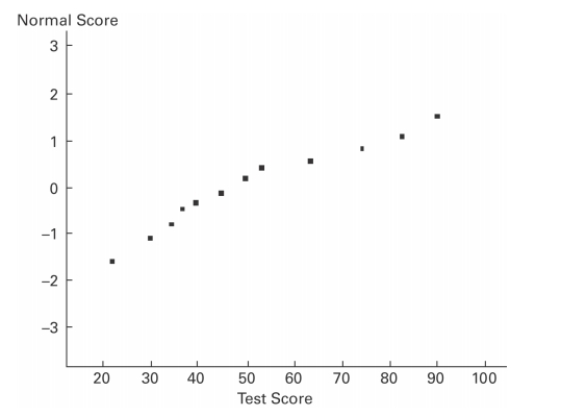
A normal quartile plot is given below for a sample of scores on an aptitude test. Use the plot to assess the normality of scores on this test. Explain your reasoning. 
Correct Answer:

Verified
Since the normal quartile plot...View Answer
Unlock this answer now
Get Access to more Verified Answers free of charge
Correct Answer:
Verified
Since the normal quartile plot...
View Answer
Unlock this answer now
Get Access to more Verified Answers free of charge
Related Questions
Q6: If z is a
Q7: Estimate the indicated probability by using the
Q8: The given values are discrete. Use the
Q9: Three randomly selected households are surveyed as
Q10: The heights of adult females are normally
Q12: Define a density curve and describe the
Q13: State the central limit theorem. Describe the
Q14: Assume that the red blood cell counts
Q15: In one region, the September energy consumption
Q16: Using the following uniform density curve, answer