Essay
A normal quartile plot is given below for the weekly incomes (in dollars)of a sample of engineers in one town. Describe what each x value represents and what each y value
represents. Use the plot to assess the normality of the incomes of engineers in this town.
Explain your reasoning. 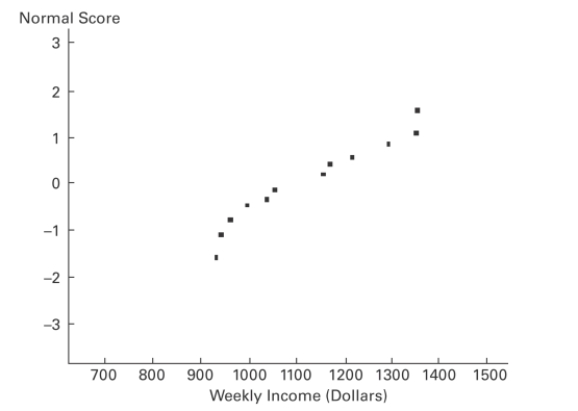
Correct Answer:

Verified
Each x-value is from the original set of...View Answer
Unlock this answer now
Get Access to more Verified Answers free of charge
Correct Answer:
Verified
View Answer
Unlock this answer now
Get Access to more Verified Answers free of charge
Q35: Assume that the red blood cell counts
Q36: A coin is tossed 20 times. A
Q37: Assume that the weight loss for
Q38: If a histogram of a sample of
Q39: Lengths of pregnancies are normally distributed with
Q41: A normal quartile plot is given below
Q42: Find the area of the shaded
Q43: The probability that a radish seed will
Q44: SAT verbal scores are normally distributed with
Q45: Which of the following is a biased