Multiple Choice
Construct a boxplot for the given data. Include values of the 5-number summary in all boxplots. The test scores of 40 students are listed below.
A) 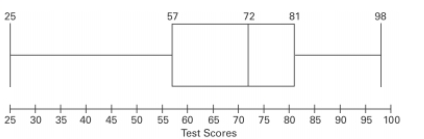
B) 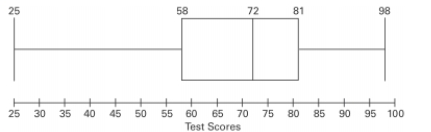
C) 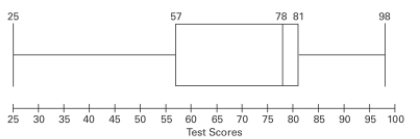
D) 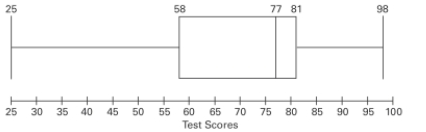
Correct Answer:

Verified
Correct Answer:
Verified
Related Questions
Q34: An online service ran a poll of
Q35: The following are interval times (minutes)between
Q36: Which of the following is not a
Q37: The race speeds (in minutes) for
Q38: If your score on your next statistics
Q40: A store manager kept track of
Q41: A student earned grades of B, B,
Q42: When finding percentiles, if the locator
Q43: An engineer is designing a machine to
Q44: The mean height of a basketball team