Essay
Describe any similarities or differences in the two distributions represented by the following boxplots. Assume the two boxplots have the same scale. 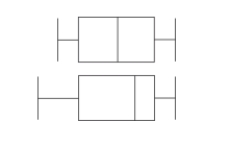
Correct Answer:

Verified
Correct Answer:
Verified
Related Questions
Q16: Human body temperatures have a mean
Q17: How will a high outlier in a
Q18: The owner of a manufacturing plant
Q19: Find the variance for the given
Q20: Approximately what percentage of apple diameters is
Q22: The tallest living man has a height
Q23: The number of vehicles passing through
Q24: Use the given sample data to
Q25: A comparison is made between summer
Q26: Use the following duration times (seconds)