Multiple Choice
Attendance records at a school show the number of days each student was absent during the year. The days absent for each student were as follows.
Which of these choices display the correct dotplot?
A) 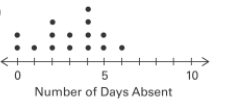
B) 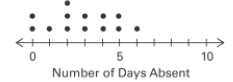
C) 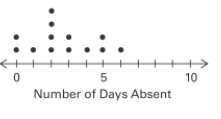
D) 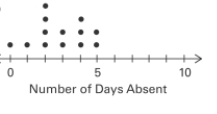
Correct Answer:

Verified
Correct Answer:
Verified
Related Questions
Q28: The Kappa Iota Sigma Fraternity polled its
Q29: The following frequency distribution depicts the
Q30: In a survey, 26 voters were
Q31: The linear _ coefficient denoted by r
Q32: In a survey, 20 people were
Q34: A bar chart and a Pareto chart
Q35: Analysis of the data from 25 mothers
Q36: Identify the cumulative frequency distribution that
Q37: Define the difference between a Relative Frequency
Q38: A nurse measured the blood pressure