Multiple Choice
The graph of for a>1 is best represented by which graph?
A) 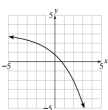
B) 
C) 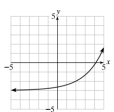
D) 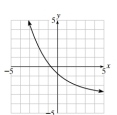
Correct Answer:

Verified
Correct Answer:
Verified
Related Questions
Q76: The graph of the function<br> <span
Q77: Write a proof by mathematical induction
Q78: Show that the points A(1,-3), B(-8,1),
Q79: Solve the double inequality <br> <span
Q80: The graph below shows the regression
Q82: Graph the relation defined by the
Q83: Solve the system by any method.<br>3 x+4
Q84: Solve the inequality <span class="ql-formula"
Q85: For the function y=4+ln (x+1)
Q86: Determine the range of <span