Short Answer
The graph below shows the regression line for the data. The correlation coefficient is . Is it correct to say this data show strong positive correlation? 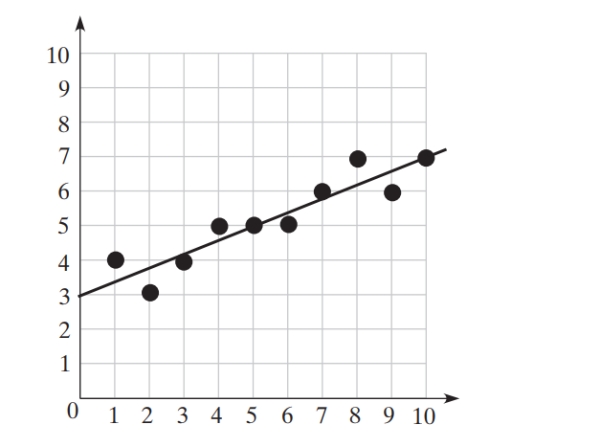
Correct Answer:

Verified
Correct Answer:
Verified
Related Questions
Q67: A Solve the system graphically.<br>Round the
Q68: Solve the system graphically. Round the
Q69: What is the smallest interval for
Q70: Simplify: (csc x-tan x) sin
Q71: The table shows average salaries for
Q73: The following three transformations are applied
Q74: Let <span class="ql-formula" data-value="f(x)=\sqrt{x-3}"><span class="katex"><span
Q75: Determine the sum, if it exists,
Q76: The graph of the function<br> <span
Q77: Write a proof by mathematical induction