Essay
The following table shows the weekly total sales (in dollars) at a small roadside vegetable stand for the months June through September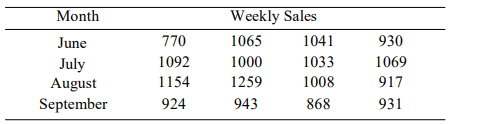
i). Construct an ANOVA table.
ii). Can you conclude that the weekly sales varies with the month? Use the Į = 0.05 level of significance.
Correct Answer:

Verified
None...View Answer
Unlock this answer now
Get Access to more Verified Answers free of charge
Correct Answer:
Verified
View Answer
Unlock this answer now
Get Access to more Verified Answers free of charge
Q130: For the following observed and expected
Q131: The following MINITAB output presents a
Q132: Use the given set of points
Q133: Use the given set of points
Q134: Interpret the interaction plot by explaining whether
Q136: In a study of reaction times,)
Q137: The following MINITAB output presents a
Q138: An experiment is conducted to study
Q139: How many degrees of freedom are
Q140: Following are observed frequencies. The null