Essay
The graph shown below represents a company's profit (y-axis)in dollars based on the number of items (x-axis)produced by the company. 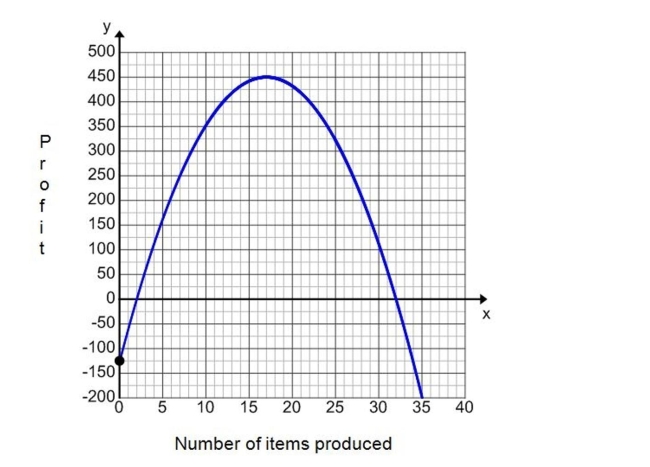
a. What is the y-intercept of this graph? What does it represent?
b. What are the x-intercepts of this graph? What do they represent?
c. What is the maximum amount of profit this company can earn?
d. How many items must the company produce in order to reach the maximum profit?
Correct Answer:

Verified
a. (0, -125)With no items prod...View Answer
Unlock this answer now
Get Access to more Verified Answers free of charge
Correct Answer:
Verified
View Answer
Unlock this answer now
Get Access to more Verified Answers free of charge
Q144: Factor completely. <img src="https://d2lvgg3v3hfg70.cloudfront.net/TB5887/.jpg" alt="Factor completely.
Q145: Solve the equation by using the quadratic
Q146: Graph the function <img src="https://d2lvgg3v3hfg70.cloudfront.net/TB34225555/.jpg" alt="Graph the
Q147: Multiply the polynomials. <img src="https://d2lvgg3v3hfg70.cloudfront.net/TB5887/.jpg" alt="Multiply the
Q148: Write the equation in the form
Q150: Find the simple interest and the
Q151: Factor the binomial completely. <span
Q152: Simplify.<br><img src="https://d2lvgg3v3hfg70.cloudfront.net/TB34225555/.jpg" alt="Simplify. A)
Q153: Simplify. Write your answer in exponent form.
Q154: Factor the binomial completely. <img src="https://d2lvgg3v3hfg70.cloudfront.net/TB5887/.jpg" alt="Factor