Essay
The following table shows the U.S. population for the years 1920-2000. 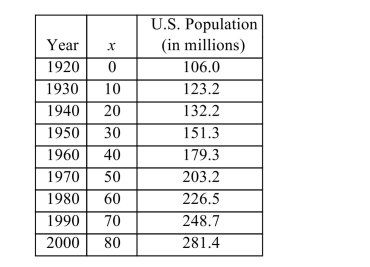
a. Determine whether the equation of best fit for this data will be quadratic or exponential, and find the equation of the best fit. Round coefficients to 4 decimal places.
b. What is the y-intercept and what does it represent?
c. Would an x-intercept make sense in this case? If so, find it. If not, explain why not.
d. At approximately what rate is the U.S. population growing?
e. Use the equation to estimate the U.S. population in 2013. Round to the nearest tenth of a million.
f. Using the equation, when will the U.S. population break 400 million?
Correct Answer:

Verified
Correct Answer:
Verified
Q92: Find the total amount for the investment
Q93: Subtract the polynomials.<br><img src="https://d2lvgg3v3hfg70.cloudfront.net/TB34225555/.jpg" alt="Subtract the polynomials.
Q94: Carla deposited $12,400 into an account paying
Q95: Simplify the expression. Write the answer
Q96: Clear parentheses and combine like terms. <img
Q98: Add the polynomials. <span class="ql-formula"
Q99: Write the number in scientific notation. <img
Q100: <img src="https://d2lvgg3v3hfg70.cloudfront.net/TB5887/.jpg" alt=" a. When does
Q101: Graph the function <span class="ql-formula"
Q102: Find the vertex of the parabola. <img