Short Answer
The price per share of stock (in dollars)over a period of 5 days is shown in the
graph. 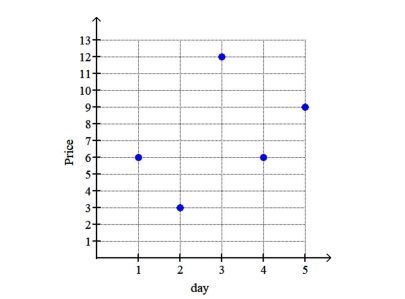 What was the loss between day 3 and day 4?
Correct Answer:

Verified
Correct Answer:
Verified
Related Questions
Q1: Complete the table of points for the
Q2: Sketch the graph of 2x = 11.
Q3: Find the slope and y-intercept of the
Q5: Find the slope of the line that
Q6: Find the slope and y-intercept, and use
Q7: Solve the system using the substitution method.
Q8: Solve the system using the substitution method.
Q9: Sketch the graph of the equation.<br>4x +
Q10: Sketch the graph of the equation. <img
Q11: Determine the slope by using the slope