Multiple Choice
The figure represents the results of a survey on favorite foods. 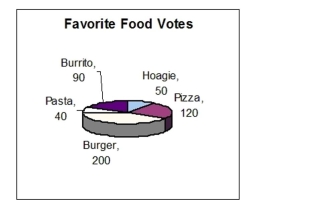 Compare the number of votes for burgers and hoagies.
A) There were 4 times as many votes for burgers as for hoagies.
B) There were 4.5 times as many votes for burgers as for hoagies.
C) There were 3 times as many votes for burgers as for hoagies.
D) There were 3.5 times as many votes for burgers as for hoagies.
Correct Answer:

Verified
Correct Answer:
Verified
Q263: A used car dealership sells several makes
Q264: Simplify. <img src="https://d2lvgg3v3hfg70.cloudfront.net/TB5887/.jpg" alt="Simplify. " class="answers-bank-image
Q265: Multiply and write the answer as a
Q266: The table provided gives the expenses for
Q267: Subtract. Write the answer as a fraction
Q269: Complete the table. <img src="https://d2lvgg3v3hfg70.cloudfront.net/TB5887/.jpg" alt="Complete the
Q270: In a recent survey 38% of the
Q271: Find the mean. <img src="https://d2lvgg3v3hfg70.cloudfront.net/TB5887/.jpg" alt="Find the
Q272: Travis wrote five checks to the employees
Q273: Complete the table. <img src="https://d2lvgg3v3hfg70.cloudfront.net/TB5887/.jpg" alt="Complete the