Multiple Choice
The figure represents the results of a survey on favorite foods. 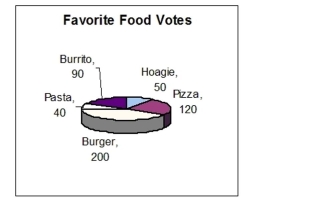 What is the total number of votes represented in this graph?
A) 500 votes
B) 550 votes
C) 400 votes
D) 450 votes
Correct Answer:

Verified
Correct Answer:
Verified
Related Questions
Q115: A teacher surveyed her class about their
Q116: Renee pays 28% of her salary in
Q117: Write the next three numbers in the
Q118: Label the angle as an obtuse angle,
Q119: Diabetics need to keep close watch on
Q121: Subtract. Write the answer as a fraction
Q122: Use the conversions sheet to help you
Q123: Find the mean. <img src="https://d2lvgg3v3hfg70.cloudfront.net/TB5887/.jpg" alt="Find the
Q124: Translate to a mathematical expression. Then simplify.
Q125: Refer to the graph indicating the change