Multiple Choice
The figure represents the results of a survey on favorite foods. 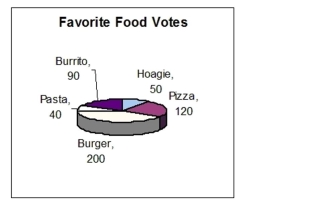 How many more people voted for burgers than for pizza?
A) 80 people
B) 60 people
C) 40 people
D) 100 people
Correct Answer:

Verified
Correct Answer:
Verified
Q172: Estimate the sum by first rounding each
Q173: Subtract. Write the answer as a fraction
Q174: Write the repeated multiplication in exponential form.
Q175: Multiply the fractions. <img src="https://d2lvgg3v3hfg70.cloudfront.net/TB5887/.jpg" alt="Multiply the
Q176: The sales tax on a bookcase is
Q178: Refer to the number line to add
Q179: Multiply. <img src="https://d2lvgg3v3hfg70.cloudfront.net/TB5887/.jpg" alt="Multiply. " class="answers-bank-image
Q180: Simplify. 120 ÷ 4. 3<br>A)90<br>B)40<br>C)10<br>D)30
Q181: For the English sentence below, write a
Q182: A contractor bought 48 concrete blocks at