Multiple Choice
The figure represents the results of a survey on favorite foods. 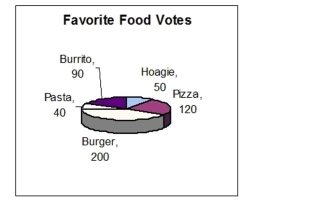 What percent of the votes were for pizza?
A) 23%
B) 25%
C) 22%
D) 24%
Correct Answer:

Verified
Correct Answer:
Verified
Q132: A coat is on sale for $200.
Q308: Multiply.<br><img src="https://d2lvgg3v3hfg70.cloudfront.net/TB34225555/.jpg" alt="Multiply. A)
Q309: For the English sentence below, write a
Q310: Convert the metric unit of length using
Q311: Simplify. 42 ÷ 3 ÷ 2<br>A)7<br>B)9<br>C)10<br>D)8
Q312: Evaluate: <img src="https://d2lvgg3v3hfg70.cloudfront.net/TB5887/.jpg" alt="Evaluate: " class="answers-bank-image
Q313: Multiply. <img src="https://d2lvgg3v3hfg70.cloudfront.net/TB5887/.jpg" alt="Multiply. " class="answers-bank-image
Q314: Multiply the number by the power of
Q315: Add. Write the answer as a fraction
Q318: Use a protractor to construct an angle