Essay
Consider this bar graph found in an advertisement for a performance supplement. Compare it to the
second bar graph, which represents the same data. 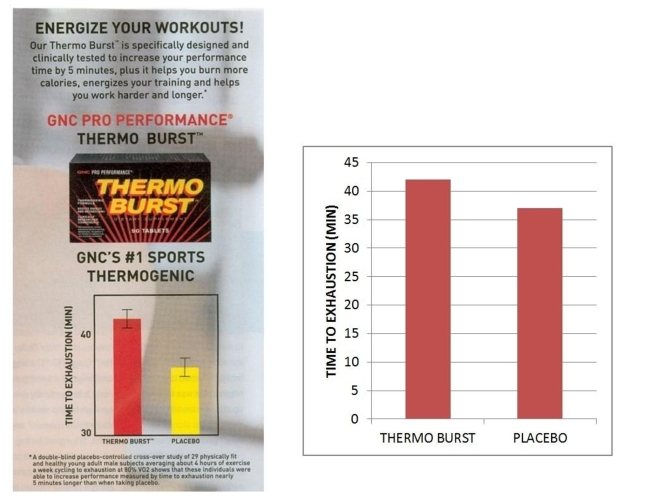 a. Estimate the average time to exhaustion using Thermo Burst.
b. Estimate the average time to exhaustion for those taking the placebo.
c. Why do the graphs look so different? Explain how the graph on the left might be used to mislead the reader.
Correct Answer:

Verified
a. About 42 minutes
b. About 37 minutes
...View Answer
Unlock this answer now
Get Access to more Verified Answers free of charge
Correct Answer:
Verified
b. About 37 minutes
...
View Answer
Unlock this answer now
Get Access to more Verified Answers free of charge
Q19: Fifty people participated in a poll to
Q20: A bike that originally cost $129.99 is
Q21: Convert the unit of time. <img src="https://d2lvgg3v3hfg70.cloudfront.net/TB5887/.jpg"
Q22: Label the angle as an obtuse angle,
Q23: Fill in the blank with < or
Q25: Subtract. Write the answer as a fraction
Q26: Find the simple interest and the total
Q27: The table gives the scores for the
Q28: Convert the units of length using unit
Q29: <img src="https://d2lvgg3v3hfg70.cloudfront.net/TB5887/.jpg" alt=" nd" class="answers-bank-image d-block"