Essay
Examine the given run chart or control chart and determine whether the process is within
statistical control. If it is not, identity which of the three out-of-statistical-control criteria
apply. A run chart for individual values W is shown below. Does there appear to be a pattern
suggesting that the process is not within statistical control? If so, describe the pattern. 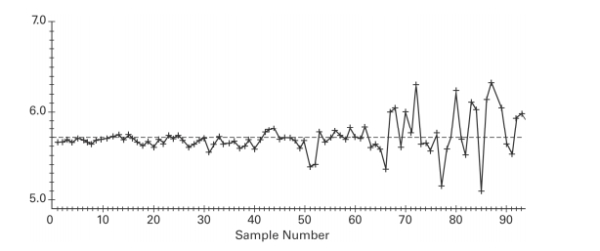
Correct Answer:

Verified
The process appears ...View Answer
Unlock this answer now
Get Access to more Verified Answers free of charge
Correct Answer:
Verified
View Answer
Unlock this answer now
Get Access to more Verified Answers free of charge
Q5: Provide the appropriate response. Describe the Wilcoxon
Q33: Draw an example of an F distribution
Q158: Use the given process data to
Q159: Assume that the number of items
Q160: The following data contains task completion
Q163: Given below are the analysis of
Q164: A control chart for <span
Q165: Suppose you are to test for
Q166: A control chart for <span
Q167: The following data shows the yield,