Essay
A control chart for is shown below._
statistical control. If it is not, identify which of the three out-of-control criteria lead to
rejection of a statistically stable mean. 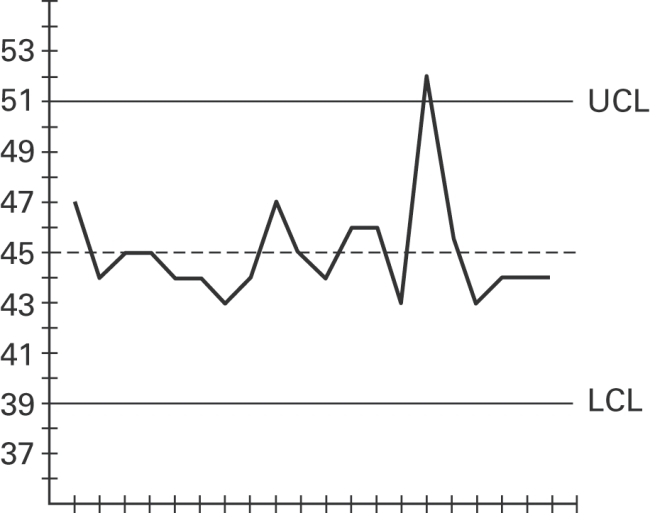
Correct Answer:

Verified
The process mean is not within...View Answer
Unlock this answer now
Get Access to more Verified Answers free of charge
Correct Answer:
Verified
The process mean is not within...
View Answer
Unlock this answer now
Get Access to more Verified Answers free of charge
Related Questions
Q9: A control chart for attributes is to
Q24: A _ is a sequential plot of
Q46: Describe the three criteria used to determine
Q55: _ variation results from causes that can
Q58: Match the parametric test with its comparable
Q107: Use the runs test to determine
Q109: Match the chart with its characteristic.<br>-Monitors
Q112: Use a Kruskal-Wallis test to test
Q115: A teacher uses two different CAI
Q116: Construct a run chart for individual