Multiple Choice
The following scatterplot shows the percentage of the vote a candidate received in the 2004_ senatorial elections according to the voter's income level based on an exit poll of voters
Conducted by CNN. The income levels 1 -8 correspond to the following income classes:
1 =Under $15,000; 2 =$15-30,000; 3=$30-50,000; 4=$50-75,000; 5=$75-100,000; 6=$100-
150,000; 7=$150-200,000; 8=$200,000 or more. 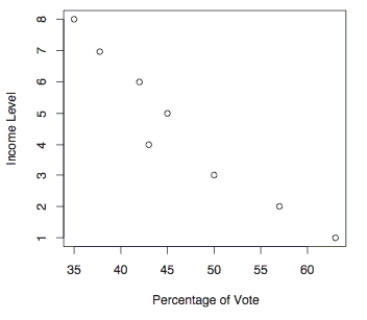 Use the election scatterplot to determine whether there is a correlation bet ween percentage of
Vote and income level at the 0.01 significance level with a null hypothesis of ρs = 0.
A) The test statistic is between the critical values, so we fail to reject the null hypothesis. There is no evidence to support a claim of correlation between percentage of vote and
Income level.
B) The test statistic is not between the critical values, so we fail to reject the null hypothesis. There is no evidence to support a claim of correlation between percentage of
Vote and income level.
C) The test statistic is between the critical values, so we reject the null hypothesis. There is sufficient evidence to support a claim of correlation between percentage of vote and
Income level.
D) The test statistic is not between the critical values, so we reject the null hypothesis. There is sufficient evidence to support a claim of correlation between percentage of vote
And income level.
Correct Answer:

Verified
Correct Answer:
Verified
Q14: Find the ranks corresponding to the ages
Q118: Test the claim that the samples
Q119: Which type of chart would be
Q120: A standard aptitude test is given
Q121: Use the given process data to
Q122: Consider process data consisting of the
Q124: Examine the given run chart or control
Q125: Examine the given run chart or control
Q126: Find the critical value. Assume that
Q127: A manufacturer of lightbulbs picks 10