Multiple Choice
Construct a scatterplot for the given data._ \begin{tabular} { c | l l l l l l l c }
& & & & & & & & \\
\hline & & & & & & & &
\end{tabular}
A) 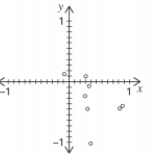
B) 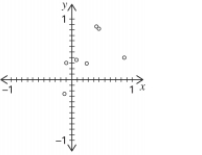
C) 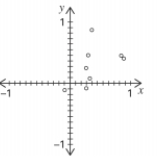
D) 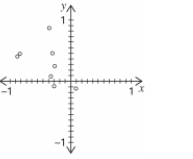
Correct Answer:

Verified
Correct Answer:
Verified
Related Questions
Q2: Given the linear correlation coefficient r
Q3: Find the value of the linear
Q4: Use computer software to find the
Q5: For the data below, determine the
Q8: Suppose you will perform a test
Q9: Use computer software to find the
Q10: The following residual plot is obtained after
Q11: When testing to determine if correlation
Q17: A regression equation is obtained for a
Q42: The residual is the difference between the