Essay
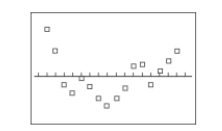
The following table gives the US domestic oil production rates (excluding Alaska)from 1987
to 2002. A regression equation was fit to the data and the residual plot is shown below.
Correct Answer:

Verified
Yes, the residual plot suggests that the...View Answer
Unlock this answer now
Get Access to more Verified Answers free of charge
Correct Answer:
Verified
Yes, the residual plot suggests that the...
View Answer
Unlock this answer now
Get Access to more Verified Answers free of charge
Related Questions
Q17: Given the linear correlation coefficient r
Q18: Use computer software to find the
Q19: The table below shows the population
Q20: The residual is the _ the observed
Q21: Use the given information to find the
Q23: Suppose you will perform a test
Q24: Use computer software to obtain the
Q26: The table lists the value y
Q27: Determine which plot shows the strongest linear
Q55: Find the coefficient of determination, given that