Multiple Choice
Find the area of the shaded region. The graph depicts the standard normal distribution with mean 0 and standard deviation 1. 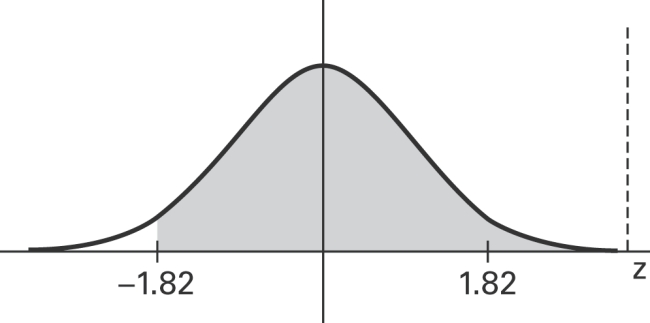
A) 0.4656
B) 0.9656
C) 0.0344
D) −0.0344
Correct Answer:

Verified
Correct Answer:
Verified
Related Questions
Q3: Define the central limit theorem and its
Q8: Suppose that you wish to find<br>minimum of
Q11: A normal quartile plot is given below
Q12: A baseball player has a batting average
Q12: Define a density curve and describe the
Q13: State the central limit theorem. Describe the
Q31: The lengths of human pregnancies are normally
Q32: After constructing a new manufacturing machine, five
Q44: SAT verbal scores are normally distributed with
Q49: Find the probability that in 200 tosses