Multiple Choice
Find the area of the shaded region. The graph depicts the standard normal distribution with mean 0 and standard deviation 1. 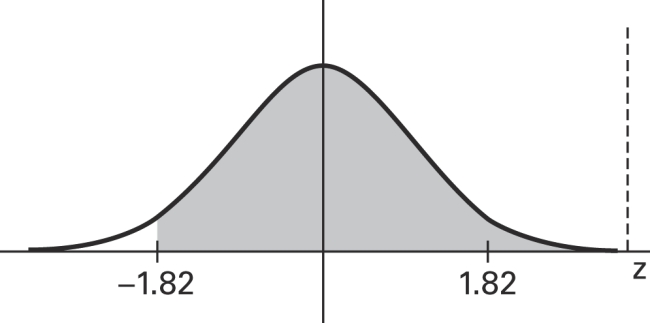
A) 0.4656
B) 0.9656
C) 0 . 0 3 4 4
D) -0.0344
Correct Answer:

Verified
Correct Answer:
Verified
Related Questions
Q6: Scores on a test have a
Q8: Suppose that you wish to find<br>minimum of
Q9: Three randomly selected households are surveyed as
Q11: A normal quartile plot is given below
Q13: State the central limit theorem. Describe the
Q20: The given values are discrete. Use the
Q28: If a sample size is < _,
Q44: SAT verbal scores are normally distributed with
Q52: Estimate the probability of getting exactly 43
Q55: The continuity correction is used to compensate